
Beyond the Soil
NDVI Satellite Imagery
Get the full picture with regular crop health updates from space — delivered straight into your Schedule-it Platform.
Standard satellite views often paint fields in flat, uniform shades of green, masking hidden issues. Our Custom High-Contrast NDVI Mapping shatters that limitation — giving both tree-crop growers and broadacre farmers unparalleled spatial clarity, fully integrated into the Schedule-it Platform.
For Horticulture / Orchards
Track canopy development, pinpoint block-by-block vigor variations, and protect your tree health.
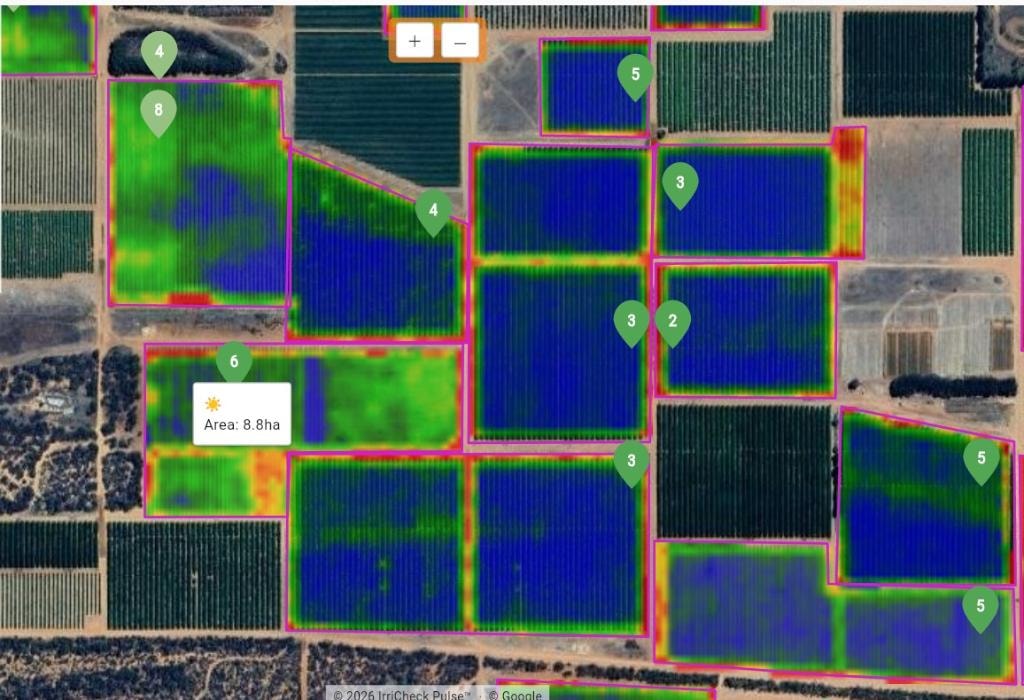
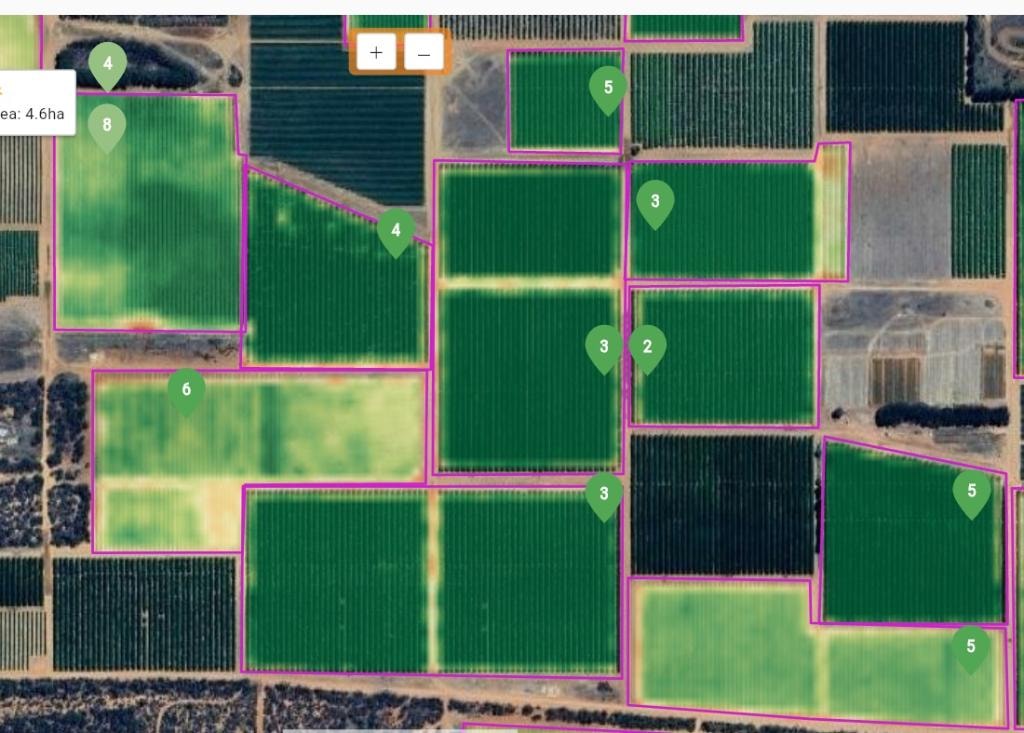
Standard NDVI blends subtle crop variations into uniform green — compaction zones, wheel tracks, and emerging stress are nearly invisible until it's too late. The Schedule-it Custom View amplifies those hidden differences using deep blues, sharp greens, and stark reds, instantly exposing track lines, soil shifts, and localised health anomalies across every orchard block.
For Broadacre Crops
Map massive acreage instantly to identify failing irrigation lines, header tracks, and variable growth zones.
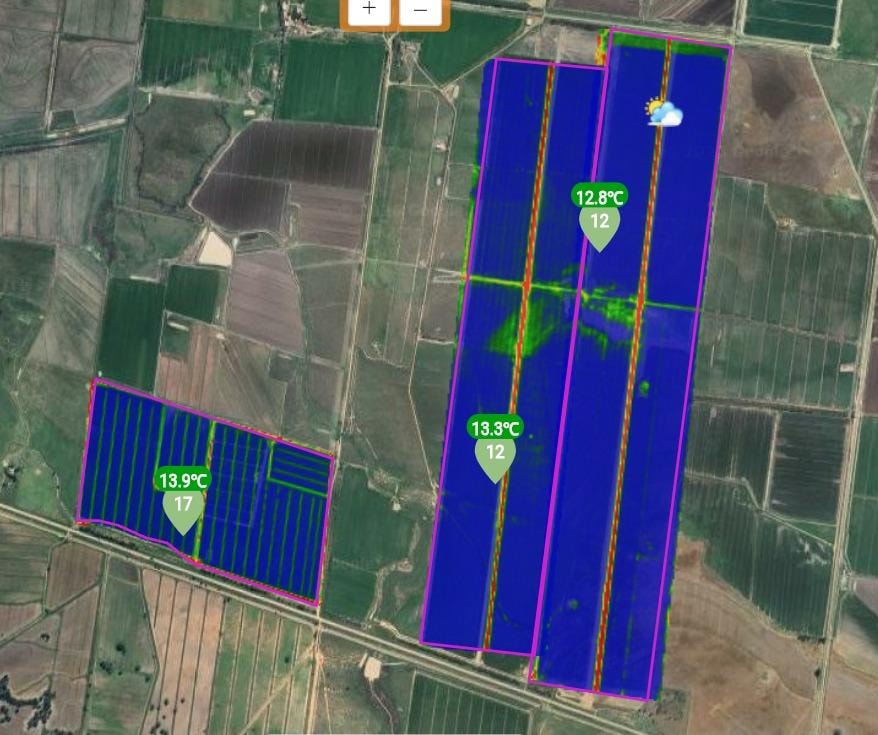
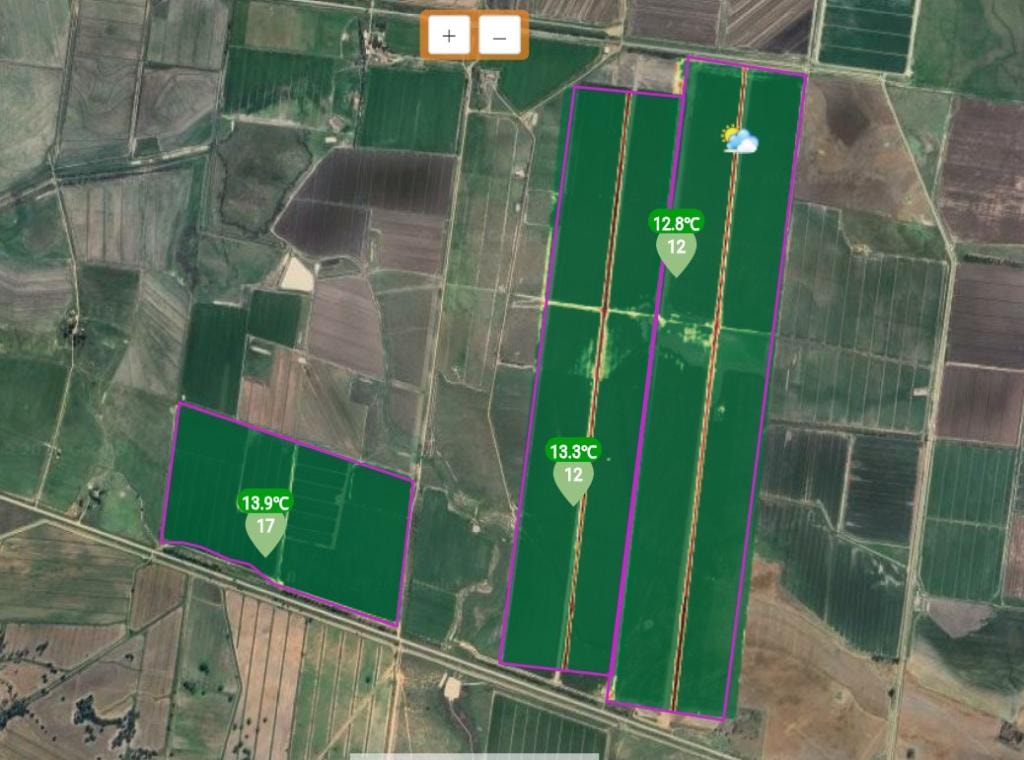
Flat green tones from standard NDVI mask irrigation line failures, header tracks, and variable growth zones across large paddocks. The Schedule-it Custom View reveals those anomalies across every hectare in high-definition contrast — so you can act before they cost you yield.
Expert Interpretation Included
You don't have to guess what the colour shifts mean. Our irrigation specialists analyse these high-contrast maps alongside your soil probe data to guide your watering strategy — so every decision is backed by both ground-level and aerial intelligence.
What our NDVI maps reveal
Irrigation failures
Spot broken lines, blocked emitters, or under-watered zones before they damage yield.
Crop stress hotspots
Identify nutrient deficiencies, disease pressure, or waterlogging at a block level.
Compaction & wheel tracks
See exactly where machinery traffic is suppressing growth across your paddocks.
Vigor variability
Understand which blocks are performing and which need attention — at a glance.
Regular updates
Imagery delivered on a regular cadence so you can track change over the season.
Platform integrated
Maps appear directly in your Schedule-it Platform alongside soil and weather data.
Add satellite intelligence to your farm
Ask our team about adding NDVI satellite imagery to your Schedule-it subscription.
Ask about this option